- performance
- tools
- diy
How to Test Your Own Website Speed in 10 Minutes
Four free checks you can run yourself, what the numbers mean, and how to tell a real problem from a number that doesn't matter.

Md Ariful Islam
4 min read
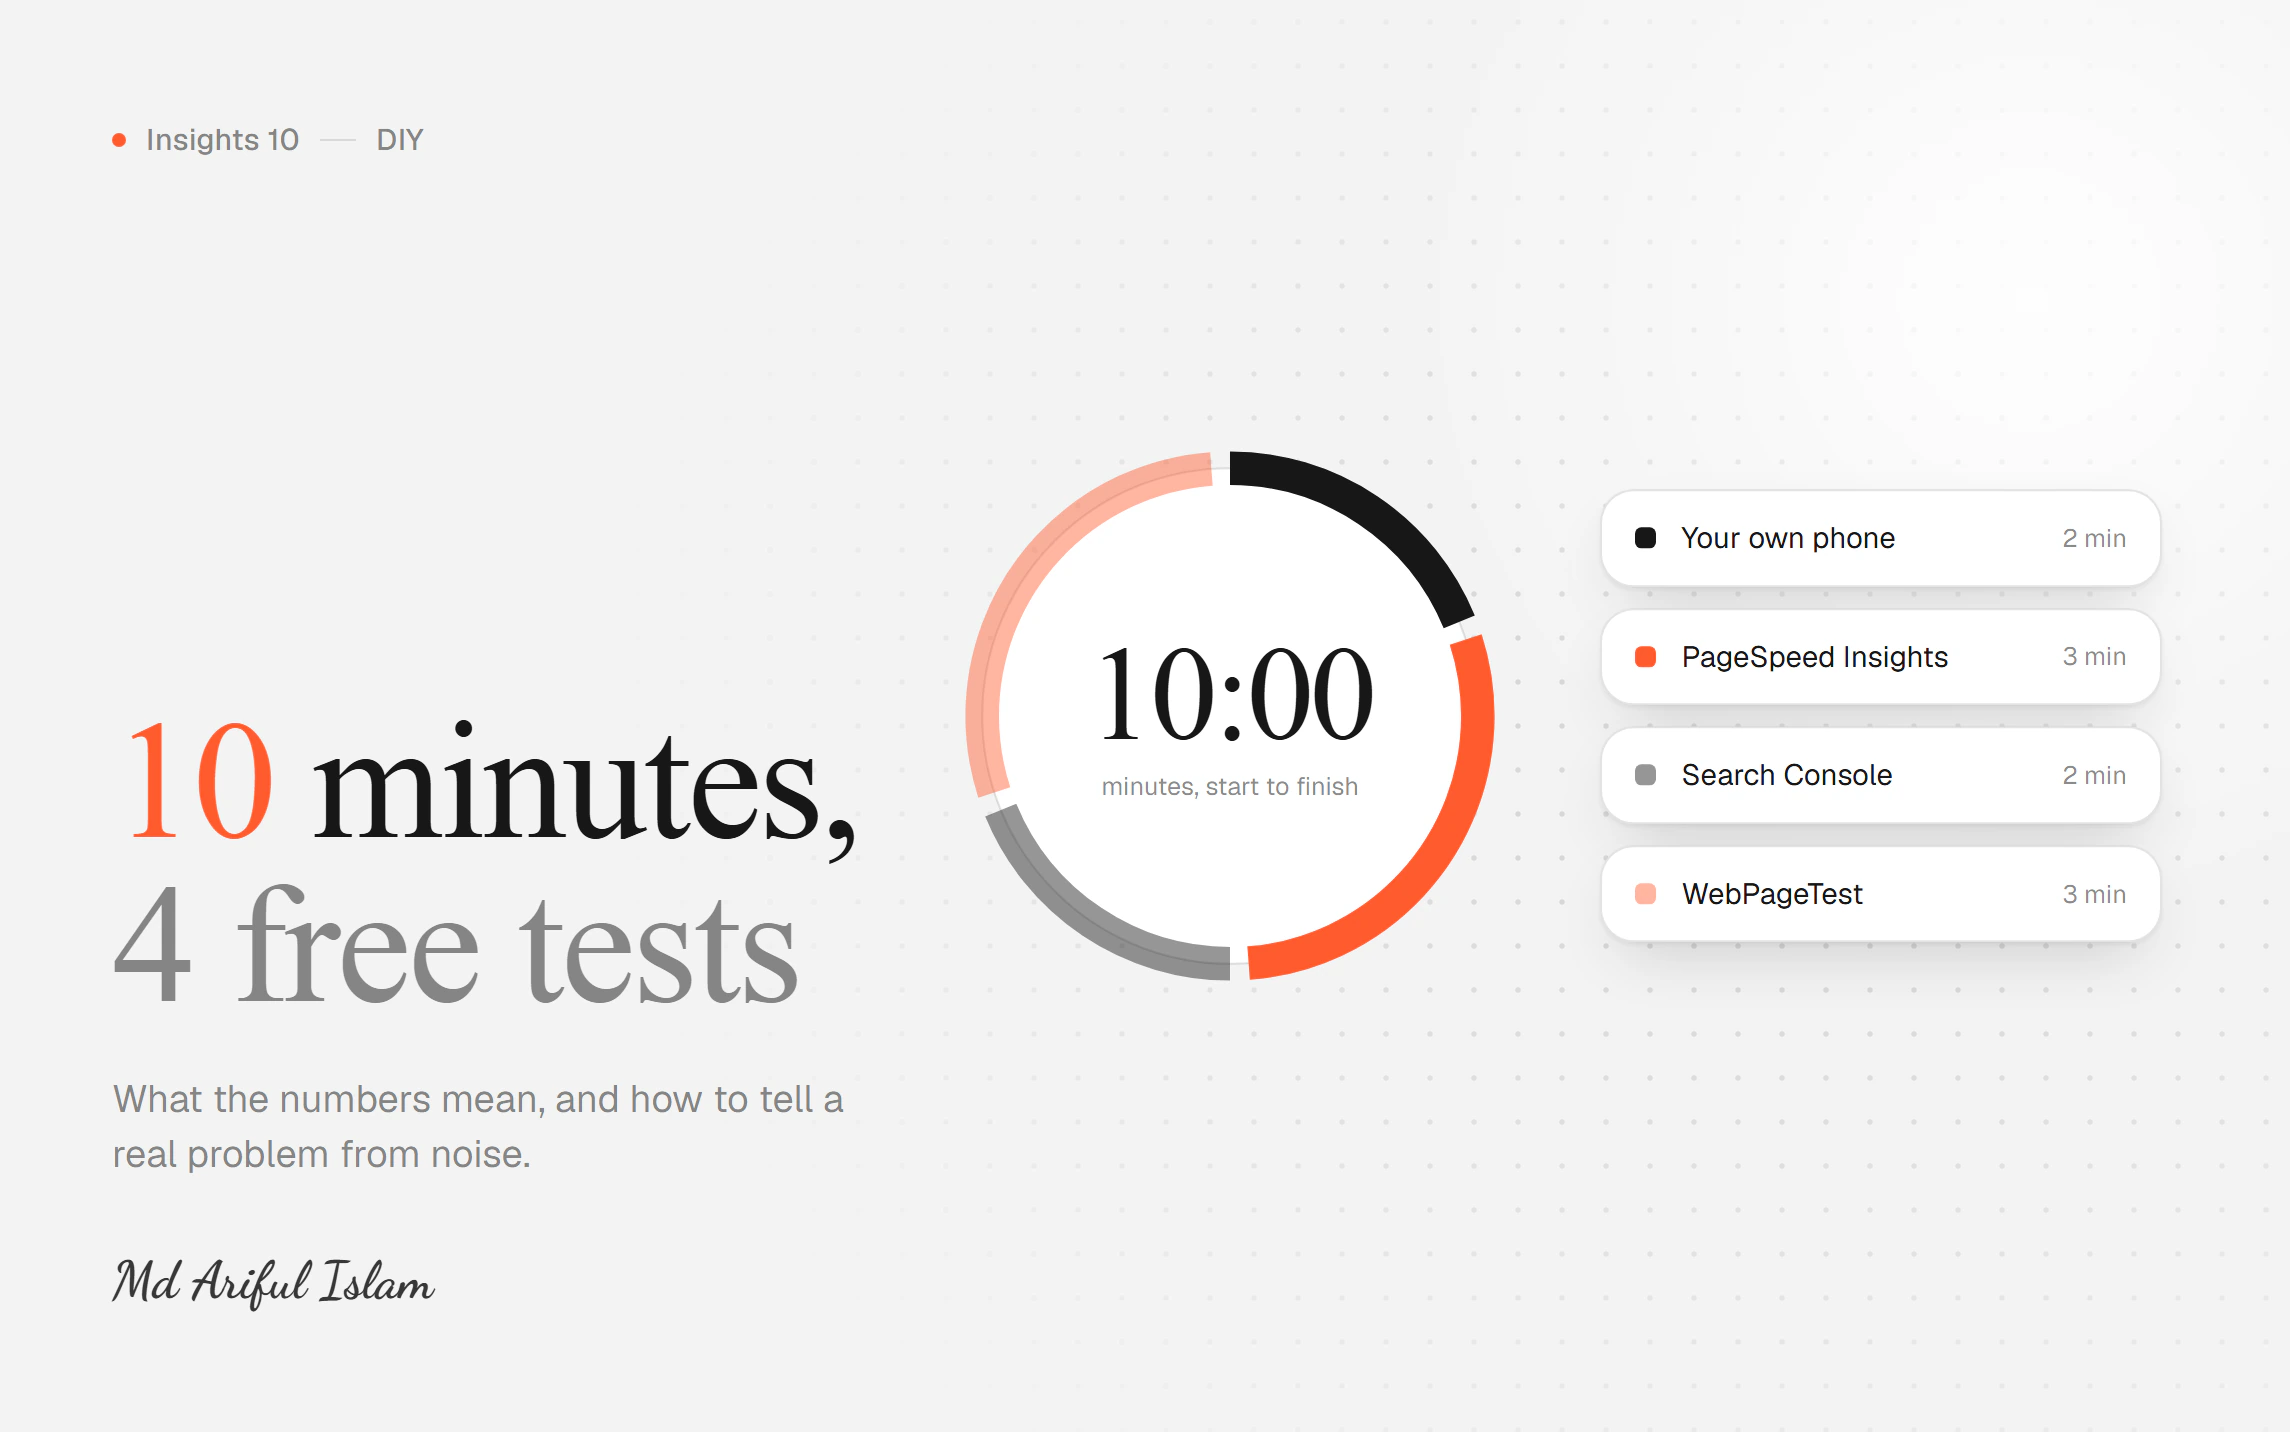
You don't need a developer to find out whether your website is slow. You need ten minutes and four free tools.
More usefully, you'll be able to tell the difference between a real problem and a number someone is trying to sell you a rebuild over.
Let's go in order of how much they'll tell you.
Test 1: Your own phone (2 minutes)
Still the most honest test there is.
- Open your site on your phone
- Turn wifi off — use mobile data
- Open a private or incognito tab, so nothing is cached
- Count the seconds out loud until you can read the main heading
What the numbers mean:
- Under 2 seconds — good
- 2 to 4 seconds — you're losing people
- Over 4 seconds — most visitors never see your homepage
Do this walking outside, not sitting next to the router. That's closer to where your customers actually are.
Then do it on the oldest phone in the office. The four-year-old Android, not the new iPhone. That's where problems show up.
Test 2: PageSpeed Insights (3 minutes)
Go to pagespeed.web.dev and paste your URL. It's Google's own tool, free, no account.
Two sections, and people confuse them constantly.
The top section: real user data. This comes from actual Chrome users on your actual site. This is the one that matters. If it says "not enough data," your site doesn't get enough traffic for Google to report — skip to the lab section.
The bottom section: a lab test. A simulated phone on a simulated connection. Useful for finding specific problems, but it's not what your visitors experience.
The three numbers to look at:
| Metric | What it means | Target |
|---|---|---|
| LCP | How long until the main thing appears | Under 2.5s |
| INP | How long until a tap does something | Under 200ms |
| CLS | How much the page jumps while loading | Under 0.1 |
Important: the big score out of 100 at the top is lab data. A 74 isn't a crisis if your real-user numbers are green. Judge the real-user section first.
Test 3: Google Search Console (2 minutes)
If your site is set up in Search Console — and it should be, it's free — go to Experience → Core Web Vitals.
This shows you real user data across your whole site, not just the homepage, split into Good, Needs Improvement and Poor.
Why it beats PageSpeed Insights: it tells you which pages have problems. Often it's not your homepage at all — it's product pages, or blog posts, or one template used on forty pages.
If you're not set up in Search Console, that's worth an hour of someone's time regardless of speed.
Test 4: WebPageTest (3 minutes)
Go to webpagetest.org. Free, and more detailed than the rest.
The setting that matters: choose a test location near your customers and a mobile device with a 4G connection. Default settings will flatter you.
The thing to look at is the waterfall chart — every file your site loads, as a bar, in order.
You're looking for:
- Long bars. Something big. Usually an image.
- A cluster of bars at the start. Fonts and scripts all competing before anything renders.
- Bars from other domains. Analytics, chat widgets, ad pixels, review tools. Each one is you waiting on someone else's server.
You don't need to understand it deeply. If one bar is dramatically longer than the rest, hover it — the filename usually tells you exactly what's wrong.
Reading the results honestly
Everything green, phone test under 2 seconds? You're fine. Stop here, spend the money elsewhere. This is a genuinely common outcome and nobody will volunteer it, because there's no invoice in it.
LCP is poor? Look at your images and fonts first. That's where it lives four times out of five.
CLS is poor? Cheapest fix on this page — usually images without declared sizes, or a banner appearing late and shoving everything down. A day's work.
INP is poor? The hardest. Too much JavaScript. Needs a developer.
Lab score is bad but real-user data is green? Don't panic and don't let anyone sell you a rebuild over it. The lab is a simulation.
Real-user data is poor but it looks fine to you? Trust the data. You're on a good phone on good wifi with the site already cached. Your customers aren't.
What to do with what you found
Write down what you got, with today's date. Load time on your phone, the three Core Web Vitals, and the biggest file in the waterfall.
That's your baseline. Without it, "is it better now?" can never be answered with anything more than an opinion — and that's how people end up paying for work that can't be shown to have helped.
If you do hire someone, hand them this. A developer who's given real numbers and a clear problem does better work than one who's told "make it faster."
Ran the tests and not sure what you're looking at? Send me your results, or just the URL, and I'll tell you what's actually going on.