- core web vitals
- seo
- performance
What Core Web Vitals Actually Mean for Your Business
Google flagged your site in Search Console and you don't know what it's telling you. Here's what each metric means, what causes it, and how much it really matters.

Md Ariful Islam
4 min read
You opened Google Search Console, saw something red about "Core Web Vitals," and closed the tab.
Fair enough. Google named these things badly. But they're measuring something genuinely simple: what it feels like to use your website on a real phone.
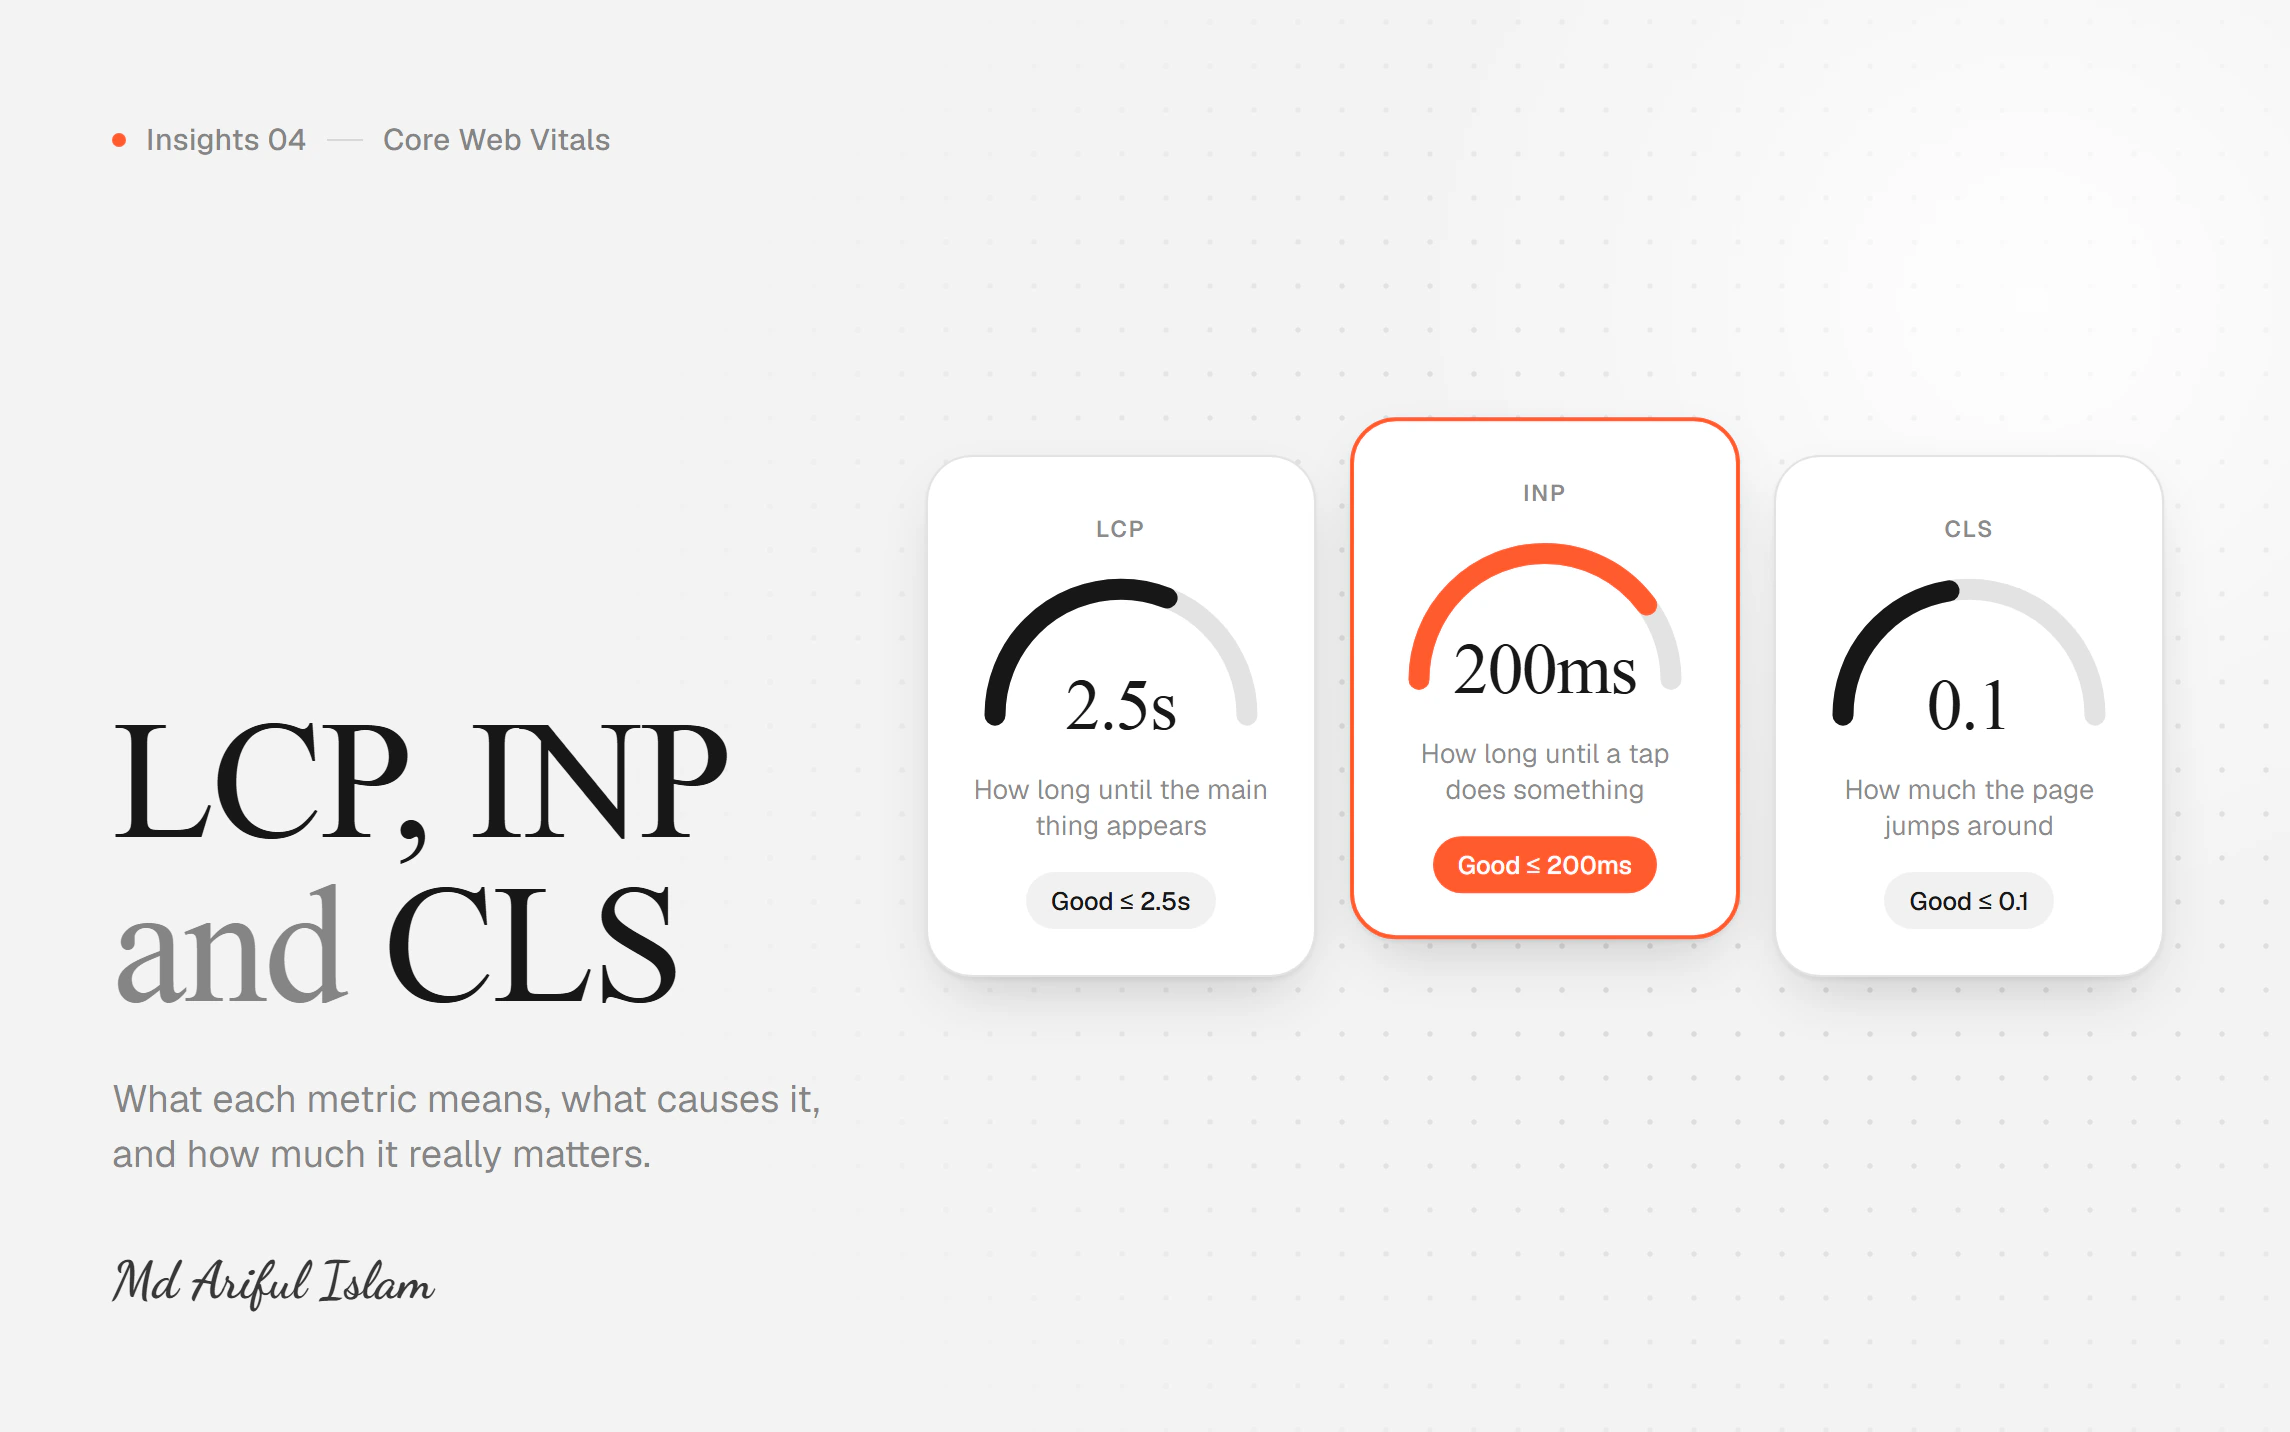
Three metrics. Here's what each one is actually saying.
LCP — how long until the main thing appears
Largest Contentful Paint. Google finds the biggest visible thing on your screen — usually a headline or a hero image — and measures how long until it shows up.
Target: under 2.5 seconds.
That's your "is this site working?" moment. Until the biggest element appears, visitors have no idea whether anything is happening.
Usual causes: an oversized hero image, fonts loading late so text is invisible, or a page that arrives empty and then asks the server what to say.
How bad is bad? This is the one that costs you money directly. People leave during LCP.
INP — how long until the site responds to a tap
Interaction to Next Paint. You tap a button. How long before anything visibly happens?
Target: under 200 milliseconds.
Under 200ms feels instant. Above that, people tap again, assume it's broken, or leave.
Usual causes: too much JavaScript running at once. The browser is busy doing something else and can't respond to your tap yet.
How bad is bad? Mostly affects sites with real interaction — filters, carts, forms. A brochure site with poor INP is annoying but not expensive.
CLS — how much the page jumps around
Cumulative Layout Shift. You go to tap "Add to cart," an image loads above it, everything shifts down, and you tap "Remove" instead.
Target: under 0.1 (this one's a score, not a time).
Usual causes: images without declared dimensions, so the browser doesn't reserve space. Banners and cookie notices that appear late and shove everything down. Fonts swapping and changing line heights.
How bad is bad? Genuinely infuriating for users, and the cheapest of the three to fix — usually a day's work.
The thing most people get wrong
There are two kinds of speed data, and they are not the same.
Lab data comes from Lighthouse in your browser. A simulated device, a simulated connection, one moment in time. Useful for finding problems.
Field data comes from real Chrome users on your real site. Actual phones, actual networks, actual conditions.
Core Web Vitals uses field data. So when your developer says "it scores 100 on my machine," that's the lab. It doesn't override what your actual visitors are experiencing.
This also cuts the other way. A Lighthouse score of 74 isn't automatically a crisis. If your field data sits inside the thresholds, chasing the last 26 points is vanity.
Check Search Console before you pay anyone to chase a number in a browser tab.
How much does this affect my Google ranking?
Less than most SEO agencies imply, and more than most developers admit.
Core Web Vitals is a ranking factor. It's a small one. It will not rescue thin content, and it will not beat a competitor with better information on the topic.
What it does do is decide close calls. When two pages are otherwise similar, the faster one tends to win.
But here's the part worth remembering: even if it changed nothing about your ranking, it would still be worth fixing. These metrics describe real frustration experienced by real people who were interested enough to click. The SEO benefit is a bonus on top of not annoying your customers.
How to check yours in five minutes
Google Search Console → Experience → Core Web Vitals. This is your real-user data, split into Good, Needs Improvement and Poor. Start here. It's free and it's the truth.
PageSpeed Insights (pagespeed.web.dev) → paste your URL. The top section shows field data if Google has enough visitors to report on. The bottom section is a lab test with specific suggestions.
If you see "not enough data" — your site doesn't get enough Chrome traffic for Google to report. Use the lab test and fix what it finds.
What to do with what you find
All green? Stop. Spend your money on something else. This is a genuinely common outcome and nobody will tell you, because there's no invoice in it.
LCP is poor? Start with your images and your fonts. That's where it lives, four times out of five.
CLS is poor? Cheapest fix on this page. Declare image dimensions, reserve space for anything that appears late.
INP is poor? The hardest. Means your JavaScript needs work, and that takes a developer.
What a fix realistically costs
Not a redesign.
On one rebuild I did, mobile performance went from 74 to 100 and load time from 3.5 seconds to 0.9 — and I didn't change a single word of the content. Same headline, same sections, same images. Only the architecture underneath.
Most Core Web Vitals problems are days of work, not months. If someone has quoted you a full rebuild to fix a red box in Search Console, get another opinion first.
Got a red metric and no idea which one to worry about? Tell me which one it is and I'll tell you what usually causes it.